
Choose a measurable change, extract a rate from time data or a tangent, and evaluate what an experiment really supports.
Average rate and instantaneous rate answer different questions
An average rate over an interval is change in measured quantity divided by elapsed time. For a reactant concentration that decreases, the gradient is negative; the positive rate of disappearance is the negative of that gradient. Product concentration generally increases and gives a positive gradient. Include units from the axes.
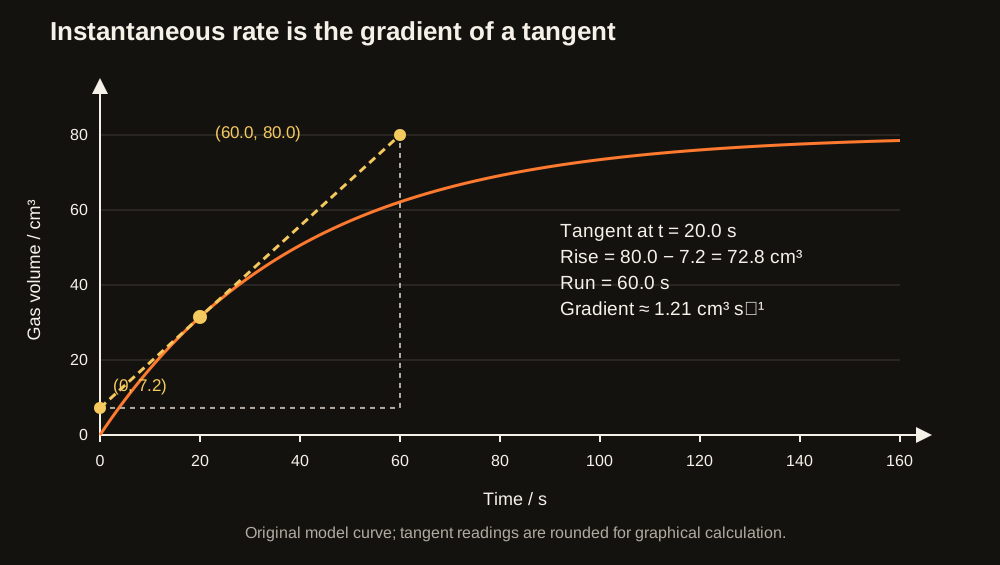
An instantaneous rate is the gradient of the tangent at a particular time. Draw a tangent that matches the curve locally, choose two widely separated points on that tangent and calculate rise/run. Those points need not be experimental data points. Joining two points on the curved trace gives an average over that interval, not a tangent rate.
The initial rate is the tangent at t = 0. It is often highest because reactants have not been depleted, but this is not a definition that guarantees the fastest rate in every reaction. Autocatalysis, an induction period or warming can make a later rate greater; use the actual data.
A worked gas-volume graph
For the constructed curve below, V rises from 0 to 50.6 cm³ over the first 40.0 s. Average rate over that interval ≈ 50.6/40.0 = 1.27 cm³ s⁻¹. The tangent at 20.0 s passes approximately through (0 s, 7.2 cm³) and (60.0 s, 80.0 cm³), so instantaneous rate ≈ (80.0 − 7.2)/(60.0 − 0) = 1.21 cm³ s⁻¹.
Use the tangent's rise of 72.8 cm³, not the curve's volume at 20 s. The theoretical initial gradient for this illustrative curve is 2.00 cm³ s⁻¹, which is steeper. As the trace approaches its plateau, the gradient approaches zero. The plateau is final collected volume, not the value of the initial rate.
A reactant concentration falling from 0.0800 to 0.0500 mol dm⁻³ over 15.0 s has average disappearance rate = (0.0800 − 0.0500)/15.0 = 2.00 × 10⁻³ mol dm⁻³ s⁻¹. This concentration rate cannot be labelled cm³ s⁻¹ just because another experiment used gas collection.
Swipe horizontally to view the whole diagram.
Continuous monitoring: gas volume or mass loss
CaCO₃(s) + 2HCl(aq) → CaCl₂(aq) + CO₂(g) + H₂O(l) can be followed with a gas syringe connected to a reaction flask. Start timing at mixing and record volume at short intervals. Gas loss before sealing makes the early trace unreliable; use a setup that mixes after closure if the initial rate is important. Check for leaks, a freely moving syringe and a volume range that will not overfill it.
Alternatively, place the flask on a balance and record mass as CO₂ leaves. A loose cotton-wool plug can reduce spray while allowing gas to escape. A tightly sealed bung would prevent the intended mass-loss measurement and could build pressure. Evaporation or ejected liquid also lowers mass and can falsely inflate the inferred gas-production rate; control these effects and consider a blank experiment.
Compare particle size at fixed mass, acid concentration/volume and temperature, or compare acid concentration using dilution while keeping total solution volume fixed. Measure and equilibrate the initial temperature; an exothermic reaction can warm itself, so uncontrolled temperature may confound a concentration comparison. Collect repeats and assess scatter rather than selecting only the neatest trace.
Fixed-change timing: when is 1/t meaningful?
Sodium thiosulfate and hydrochloric acid form suspended sulfur, which makes the mixture cloudy. A cross beneath the vessel can be timed until it disappears. The ionic change is S₂O₃²⁻(aq) + 2H⁺(aq) → S(s) + SO₂(g) + H₂O(l). If the same optical end point corresponds to approximately the same amount of sulfur, average rate is proportional to 1/t.
The quantity 1/t has units s⁻¹ and is a rate proxy, not a concentration rate in mol dm⁻³ s⁻¹. If run A takes 60.0 s and run B 24.0 s to the same end point, relative rate B/A = (1/24.0)/(1/60.0) = 2.50. It would be wrong to say B is slower merely because its time is smaller.
Keep total volume, liquid depth, flask, cross, lighting and viewing judgement consistent, along with acid amount and initial temperature as appropriate. Changing liquid depth changes how much sulfur is needed to obscure the cross. Use repeats, a consistent observer or an appropriate colorimeter/light sensor for a more objective threshold. The mixture releases sulfur dioxide, so use suitable small quantities and ventilation as directed; avoid inhaling it and wear eye protection.
Investigate catalysis without changing several variables
Hydrogen peroxide decomposition, 2H₂O₂(aq) → 2H₂O(l) + O₂(g), can be monitored by oxygen volume. Compare an uncatalysed control and runs with a suitable solid catalyst such as MnO₂ while keeping peroxide concentration, volume and temperature fixed. When comparing catalyst samples, control mass and particle size or accessible surface area where possible; the same mass of powder and lumps is not the same surface exposure.
A steeper initial slope supports greater catalytic rate under the tested conditions. The same final O₂ amount is expected if each run contains the same peroxide amount and reaches complete decomposition. Gas-volume measurements must use comparable temperature and pressure, since warmer gas occupies more volume. Foaming, heating and loss of liquid complicate very fast runs.
Use the supplied dilute peroxide and its hazard controls, avoid skin/eye contact and keep oxygen-producing mixtures away from combustible material and ignition sources. Do not seal the system against gas expansion. Retaining a solid after reaction supports regeneration but does not by itself prove all catalyst material is unchanged; catalytic cycles can involve reversible changes at the surface.
Read slopes, plateaux and comparison conditions separately
A curve that starts more steeply but reaches the same plateau describes a faster reaction with the same final measured amount. A higher plateau usually indicates more product formed, which may come from more limiting reagent; it is not evidence by itself of a faster initial rate. A flat trace can mean completion, equilibrium, catalyst failure or an instrument limit; decide using the chemical context.
In a homogeneous reaction, equal starting concentrations and temperature can give the same concentration-change rate in different total volumes. The larger batch can still make more total product per second because it contains more reacting material. Always distinguish a rate per unit volume from total gas production or total mass change.
Topic 9 includes these general rate investigations; the numbered Year 13 rates core practicals CP13a/13b and activation-energy CP14 are taught with Topic 16. The principles here prepare you to interpret unfamiliar apparatus without borrowing another board's practical numbering.
Quick checks
Original Finesse questions. Reveal the indicative worked solutions after attempting each question; these are not official Edexcel mark allocations.
Q1. A gas volume increases from 18.0 to 42.0 cm³ between 20.0 and 50.0 s. Find the average rate over that interval.Show answer
Rate = (42.0 − 18.0)/(50.0 − 20.0) = 24.0/30.0 = 0.800 cm³ s⁻¹. Dividing 42.0 by 50.0 gives a different interval's average.
Q2. A tangent to a reactant-concentration curve passes through (10 s, 0.080 mol dm⁻³) and (50 s, 0.020 mol dm⁻³). Find the positive rate of disappearance.Show answer
Gradient = (0.020 − 0.080)/(50 − 10) = −0.00150 mol dm⁻³ s⁻¹. Positive disappearance rate = 1.50 × 10⁻³ mol dm⁻³ s⁻¹. Use points on the tangent, not arbitrary points on the curve.
Q3. A cross disappears after 90.0 s in one run and 30.0 s in another. State the relative rates and the key assumption.Show answer
The second rate proxy is three times the first: (1/30.0)/(1/90.0) = 3.00. This requires the same amount/optical threshold of sulfur for disappearance; changing depth or lighting can invalidate it.
Q4. Why can a cotton-wool plug improve a mass-loss experiment while a sealed bung makes it unsuitable?Show answer
Cotton wool limits droplets leaving but lets the product gas escape, so mass loss better reflects gas production. A sealed bung retains gas, prevents the desired mass loss and may build pressure.
Q5. Two gas-volume curves finish at 80 cm³, but one reaches the plateau sooner. What can and cannot be concluded?Show answer
The quicker trace has a higher rate over at least part of the reaction and the same final collected amount under comparable conditions. The graph alone does not identify whether temperature, concentration, catalyst or surface area caused the difference; use the controlled-variable information.
Sources
Sources and examiner guidance (reviewed 9 October 2026)
- Pearson Edexcel 9CH0 specification, Issue 3 — Topic 9, printed p. 24; matched to 8CH0 p. 22. Outcomes and practical/mathematical guidance reviewed 9 October 2026.
- Chemrevise — Kinetics I — Pages 1–4: collision theory, distributions, rate measurement and catalysis. Original explanations correct limits of simplified concentration/pressure claims.
Finesse Tuition is not endorsed by AQA or Chemrevise. All explanations and examples here are our own.