
Read areas on a Maxwell–Boltzmann distribution, draw catalysed and uncatalysed profiles, and connect a solid catalyst's surface chemistry to industrial decisions.
The curve describes a spread, not one energy for every particle
A Maxwell–Boltzmann energy distribution shows the population spread over energy intervals at a given temperature. The horizontal axis is energy. The vertical axis may be number of molecules per energy interval or a normalised fraction density; in the first case total area represents particle number, while in the second total area is one. Read the axis before interpreting an area.
The curve starts at the origin, rises to a most probable energy and then tails towards the horizontal axis. The peak is not the mean: the long high-energy tail places the mean farther right. There is no sharp maximum energy at which the curve suddenly stops. A height at a single energy is not the fraction that can react; that fraction is the area beyond the activation threshold.
Draw a vertical line at Ea and identify the area to its right. This is the fraction with sufficient energy, not a guarantee that all such collisions react regardless of orientation. Molecular collisions continually exchange energy, so different particles enter and leave the high-energy region.
Higher temperature changes the curve, not Ea
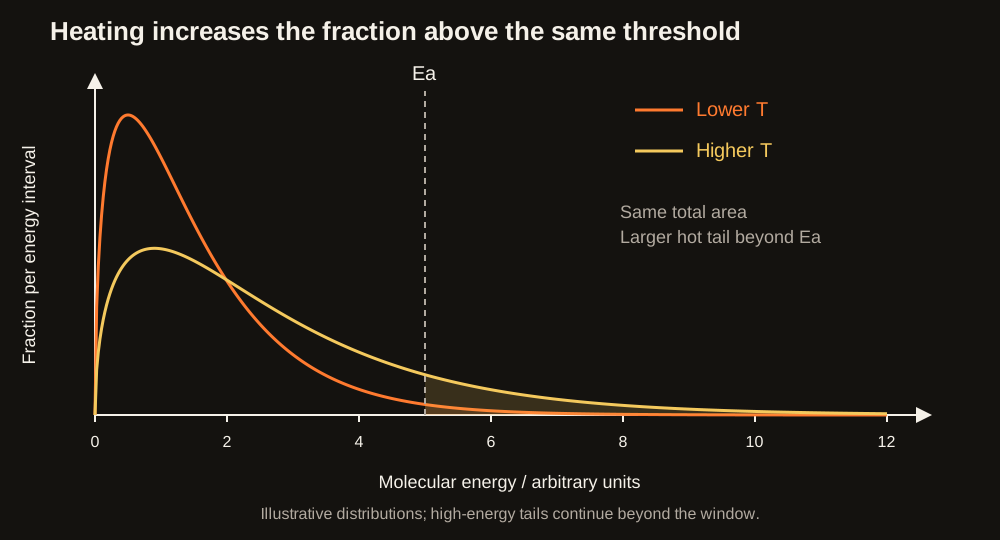
For the same number of particles at higher temperature, the curve has a lower peak farther to the right and a broader high-energy tail. Total area stays the same because particles were neither created nor added. More of that area lies beyond the same Ea, explaining the increase in the fraction of sufficiently energetic collisions.
Do not draw the whole hotter curve above the cooler curve: that would add area. Do not simply move the threshold left: that describes a lower-barrier pathway. A good comparison identifies the same sample and the same energy axis, then uses the area beyond Ea to justify the rate change.
Swipe horizontally to view the whole diagram.
A catalyst changes the available pathway
A catalyst increases rate by providing an alternative reaction route with lower activation energy. It can take part in individual steps and form intermediates, but is regenerated in the overall process. 'Never reacts' is therefore misleading. In practice a catalyst can still become poisoned, degraded or lost.
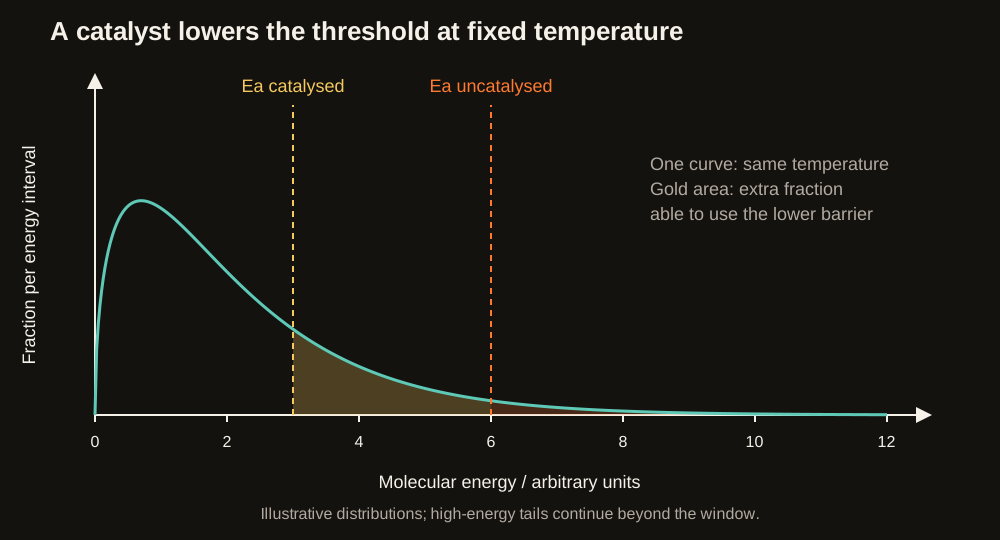
At a fixed temperature the energy distribution stays the same. Draw one curve and two thresholds: the catalysed threshold lies to the left of the uncatalysed threshold. The extra area between the thresholds represents particles now energetic enough to react by the lower-barrier route. A catalyst does not heat particles or add area to the distribution.
Swipe horizontally to view the whole diagram.
Reaction profiles keep the same endpoints
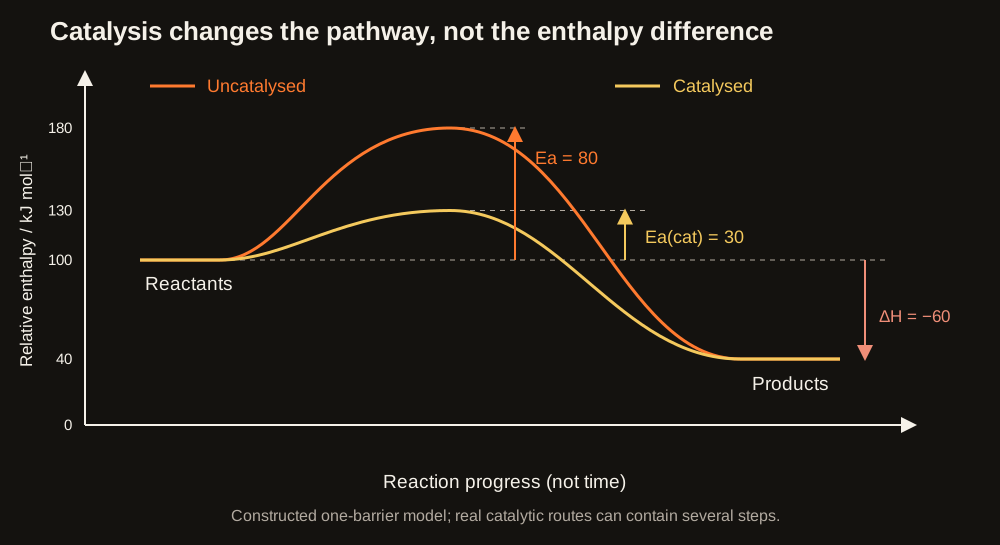
A reaction profile has enthalpy or energy on the vertical axis and reaction progress on the horizontal axis. Reaction progress is not elapsed time. Draw the catalysed and uncatalysed routes from the same reactant level to the same product level, with a lower maximum barrier for the simplified catalysed route. ΔH is unchanged because the endpoints are unchanged.
For a constructed exothermic example, take reactants at 100, products at 40, uncatalysed peak at 180 and catalysed peak at 130 kJ mol⁻¹ on a relative scale. Forward Ea changes from 80 to 30 kJ mol⁻¹. Reverse Ea changes from 140 to 90 kJ mol⁻¹; ΔH remains −60. A real catalysed mechanism may have several intermediate steps, so a lower single hump is a simplified representation.
A catalyst accelerates approach to equilibrium through forward and reverse reactions. At a fixed temperature it does not alter equilibrium composition or the equilibrium constant. It can give more product in a fixed short time before equilibrium, which must not be confused with increasing the equilibrium yield.
Swipe horizontally to view the whole diagram.
Heterogeneous catalysis happens at a surface
A heterogeneous catalyst is in a different phase from the reactants. In many industrial gas reactions the catalyst is a solid and reacting molecules attach to surface sites by adsorption. Adsorption means attachment at the surface; absorption means entry into the bulk material. The distinction describes where the process occurs.
Interaction with the surface can weaken bonds and hold reactants in a suitable arrangement. Reaction takes place through surface intermediates, then products desorb, leaving sites available again. The alternative sequence has a lower activation barrier. A large accessible surface provides more sites, so porous or finely divided catalysts are often useful; this is not simply increasing the concentration of a pure solid.
Adsorption must be neither too weak to activate reactants nor so strong that products cannot leave. Impurities can bind to active sites and poison the catalyst, reducing the accessible surface. Increasing gas pressure may increase surface coverage at first, but if sites are already saturated, a further rise can have little rate effect. Saturation is a condition to establish, not a universal assumption for every solid catalyst.
Explain the economic benefit through the process
A useful catalyst can achieve a required production rate at lower temperature, reducing energy cost. It can also increase throughput at a chosen temperature or favour a selective route that produces less unwanted material. A catalyst that enables a different overall synthetic route may improve atom economy, but adding a catalyst to an unchanged equation does not by itself change that equation's atom economy.
Economic evaluation includes catalyst purchase, scarce-metal content, lifetime, regeneration, separation and recovery. A solid catalyst can be retained while gases pass over it, simplifying separation. A costly catalyst can still be economical if it lasts and saves more in energy or feedstock than it costs. Use provided data rather than assuming the cheapest catalyst per gram gives the cheapest product.
Original comparison: route A costs £120 of heating per batch; a catalysed route costs £70 plus £10 per batch for catalyst recovery and replacement. Saving = £120 − (£70 + £10) = £40 per batch. If the catalyst equipment costs £4000, 100 similar batches recover that cost before other differences are considered. This is an illustrative calculation, not current industrial pricing.
Quick checks
Original Finesse questions. Reveal the indicative worked solutions after attempting each question; these are not official Edexcel mark allocations.
Q1. What does the area to the right of Ea represent, and why is the curve height at Ea not enough?Show answer
The area represents the fraction or number of particles with energy at least Ea, depending on vertical-axis normalisation. A single height describes one energy interval and does not add all higher-energy particles.
Q2. What stays constant when the same sample is heated: peak position, peak height, total area or fraction above Ea?Show answer
Total area stays constant because the particle number is unchanged. Peak position moves right, peak height falls and the energetic fraction increases for the usual qualitative comparison.
Q3. For an endothermic profile, reactants are at 20, products at 55 and peak at 100 kJ mol⁻¹. Calculate forward Ea, reverse Ea and ΔH.Show answer
Forward Ea = 100 − 20 = 80; reverse Ea = 100 − 55 = 45; ΔH = 55 − 20 = +35 kJ mol⁻¹. Measure each barrier from its own starting level.
Q4. Why can an impurity reduce a solid catalyst's activity even though the catalyst mass barely changes?Show answer
The impurity may occupy active surface sites, preventing reactants from adsorbing there. Available reactive surface, not just total catalyst mass, controls its useful activity.
Q5. A catalyst doubles product collected after one minute. Does that show it doubled equilibrium yield?Show answer
No. The uncatalysed mixture may not yet have reached equilibrium. A catalyst can increase the rate and short-time product amount while leaving the equilibrium composition unchanged at the same temperature.
Sources
Sources and examiner guidance (reviewed 9 October 2026)
- Pearson Edexcel 9CH0 specification, Issue 3 — Topic 9, printed p. 24; matched to 8CH0 p. 22. Outcomes and practical/mathematical guidance reviewed 9 October 2026.
- Chemrevise — Kinetics I — Pages 1–4: collision theory, distributions, rate measurement and catalysis. Original explanations correct limits of simplified concentration/pressure claims.
- Pearson 8CH0/02 June 2023 mark scheme — Q1, PDF p. 5: higher-temperature Maxwell–Boltzmann curve. Reviewed with the question and report.
- Pearson 8CH0/02 June 2023 examiner report — Q1, PDF p. 4: high-energy tails drawn too high or not approaching the axis. Reviewed 9 October 2026.
- Pearson 8CH0/02 June 2023 question paper — Q1, printed p. 2: same number of particles, higher temperature; context for the curve comparison.
Finesse Tuition is not endorsed by AQA or Chemrevise. All explanations and examples here are our own.