
Explain separation between phases, calculate Rf correctly and distinguish chromatographic separation from identification by a coupled mass spectrometer.
Different interactions create different travel times
Chromatography separates mixture components between a stationary phase and a mobile phase. Each component repeatedly interacts with both. A substance held more strongly by the stationary phase spends more time retained and moves more slowly; one favouring the mobile phase moves further or elutes sooner under the same conditions.
Depending on the system, retention involves adsorption onto a solid surface or partition between phases. Explain the relevant intermolecular attractions and solubility rather than saying a component “reacts with the paper”. A polar stationary phase can strongly retain polar analytes, but reversed-phase HPLC has a different phase arrangement, so “more polar always travels less” is not universal.
A component’s behaviour depends on the selected solvent, stationary material, temperature and other operating conditions. Separation is a balance of interactions, not a permanent speed assigned to each molecule. This is why standards must be compared under matching conditions.
Place the start line above the solvent and preserve the front
For paper/TLC work, mark a pencil baseline near the bottom, apply small concentrated spots with a capillary and let them dry between applications. Place the paper/plate in a covered developing chamber with solvent below the baseline. If the spots are submerged, sample dissolves into the reservoir rather than beginning the intended separation.
Allow solvent to rise, remove the plate before it reaches the top and immediately mark the solvent front. A covered chamber reduces evaporation and improves consistency of development. Do not use ink for the baseline because its dyes may separate and contaminate the chromatogram.
Locate colourless compounds using a method compatible with them, such as an appropriate UV-active plate/UV lamp or a chemical stain. Amino acids commonly use ninhydrin. Use the relevant eye/skin protection and ventilated handling for the locating method and solvent; a locating reagent is not the stationary phase.
Measure both distances from the same baseline
Rf is the distance from baseline to the centre of the spot divided by the distance from baseline to the solvent front. It is dimensionless and normally lies between 0 and 1. The spot’s upper edge, the bottom edge of the plate and the original reservoir surface are not the reference positions.
In the original diagram, solvent travels 80 mm; the unknown spots travel 20 mm and 48 mm. Rf values are 20/80=0.25 and 48/80=0.60. Matching reference lanes A and B supports those components in X. Reference C at 64 mm has Rf 0.80 and is not visibly matched.
Illustrative uncertainty check: a spot distance 27 ± 1 mm and front distance 60 ± 1 mm give Rf=0.450. Taking extreme ratios gives 26/61=0.426 and 28/59=0.475, so small millimetre uncertainties can blur a close comparison. Compact spots and a longer measurable run improve precision; repeated matching standards improve interpretability.
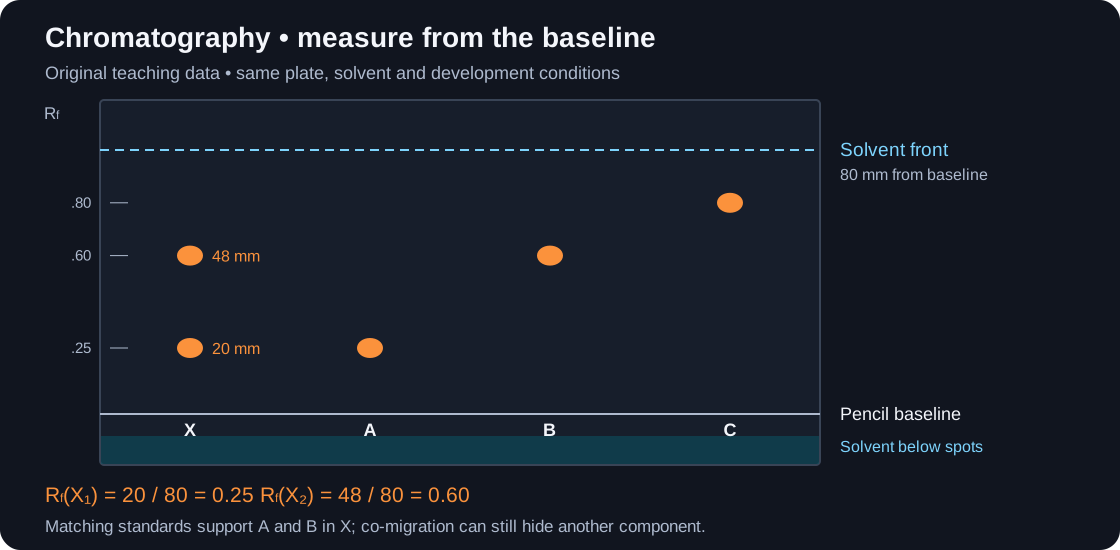
Swipe horizontally to view the whole diagram.
One spot or peak may contain more than one substance
Two substances may have similar Rf or retention times and co-migrate. Therefore one spot does not prove absolute purity and a three-spot chromatogram does not guarantee exactly three chemical species. A component below the detection limit or one unresponsive to the locating method can be missed.
For an unknown, compare standards on the same plate where possible. Changing solvent composition or stationary phase may improve separation of overlapping substances. A second analytical method can then distinguish alternatives. Two-dimensional paper chromatography is an extension that uses a second solvent direction when a question supplies it; it is not the same as changing the denominator of Rf.
When interpreting a supplied result, respect what the diagram actually shows. If no material remains at the baseline, do not explain a missing separate spot by claiming that it never moved. Consider co-migration, duplicate components in the starting material or detection limits only when consistent with the context.
Both use a column; their mobile phases differ
High-performance liquid chromatography, HPLC, pumps a liquid mobile phase through a packed column at high pressure. The stationary phase may be silica or a chemically modified bonded material. Different interactions give different retention times, measured from injection to detection of each component. HPLC can analyse suitable non-volatile or heat-sensitive substances without requiring them to vaporise.
Gas chromatography, GC, uses an inert carrier gas to move a vaporised sample through a temperature-controlled column. A common stationary phase is a thin high-boiling liquid film on a support or column wall; other GC columns use solids. The sample must be sufficiently volatile and stable under the operating conditions, or suitably derivatised when the method specifies it.
GC retention depends on volatility and interactions with the stationary phase; it is not determined solely by molecular mass or boiling temperature. Temperature, carrier-flow rate and column choice affect retention. HPLC retention also depends on solvent composition and flow, so an isolated retention-time value is not a universal identity label.
| Feature | HPLC | GC |
|---|---|---|
| Mobile phase | Liquid pumped through column | Inert carrier gas |
| Sample needs | Suitable solubility and detector response | Sufficient volatility/thermal stability under method |
| Separation basis | Different retention from phase interactions | Volatility plus phase interactions |
| Identification by retention | Compare standards under matched conditions | Compare standards under matched conditions |
Separate a mixture, then identify each eluting component
HPLC or GC can be coupled to mass spectrometry. Chromatography separates components in time; the mass spectrometer records mass-to-charge data for material leaving the column, helping identify molecular masses and characteristic fragments. A spectral-library match plus retention information is stronger than retention time alone.
In forensic or anti-doping analysis, the method can distinguish components in a complex sample, compare reference standards, detect characteristic ions and use calibration for concentration. A finding must be evaluated with blanks, standards, detection limits and the method’s selectivity; a lone peak at an expected time is not an infallible identification.
Peak area can be related to amount using an appropriate calibrated detector response. Different substances need not have the same response per mole, so area ratios do not automatically give mole percentages without response factors. The number of resolved peaks describes detected separable components, with the overlap limitations already noted.
Pearson 9CH0/03 June 2023 Q6(a–c), scheme PDF pp.24–26 and report pp.50–58, distinguishes interactions with the two phases, sensible interpretation of the actual chromatogram, a locating reagent and a further identification technique. Keep these jobs separate in your explanation.
Quick checks
Original Finesse questions. Reveal the indicative worked solutions after attempting each question; these are not official Edexcel mark allocations.
Q1. A spot centre travels 31.5 mm while solvent travels 70.0 mm from the same baseline. Calculate Rf.Show answer
Rf=31.5/70.0=0.450. The distance units cancel. Measuring from the plate’s lower edge would give a different and incorrect ratio.
Q2. Why should the original spots remain above the solvent in the developing chamber?Show answer
Submerging them lets the sample dissolve directly into the bulk solvent reservoir. Starting above it allows the rising solvent front to carry the sample through the stationary phase for separation.
Q3. On polar silica with a relatively non-polar solvent, A hydrogen-bonds more strongly to silica than B. Predict which tends to have the lower Rf.Show answer
A tends to be more strongly retained and therefore has the lower Rf, provided the stated phase interactions dominate. The prediction belongs to this specified system, not every chromatography method.
Q4. Why is HPLC often more appropriate than GC for a heat-sensitive non-volatile analyte?Show answer
HPLC carries dissolved analyte in a liquid without requiring vaporisation through a hot gas-chromatography column. GC requires suitable volatility and thermal stability under its operating conditions.
Q5. An unknown has the same retention time as a reference drug. Why couple the method to MS?Show answer
A different compound may co-elute at that time. Mass and fragment-ion information provides an additional structural comparison; blanks and calibrated reference standards also help judge whether the signal is real and specific.
Sources
Sources and examiner guidance (reviewed 9 October 2026)
- Pearson Edexcel 9CH0 specification, Issue 3 — Topic 19, printed pp.43–44; IR and NMR reference charts in Appendix 8, printed pp.95–96.
- Pearson 9CH0 data booklet — Official infrared and nuclear-magnetic-resonance reference data. Use the supplied chart rather than treating approximate example shifts as rigid boundaries.
- Chemrevise: UK Edexcel Spectroscopy and chromatography — Guide pp.6–7; relevant AS foundations and secondary cross-check. Accurate mass and carbon NMR are completed against Pearson scope and reference data.
- Pearson 9CH0/03 June 2023 mark scheme — Q6(a), Q6(b)(i–iii), Q6(c), PDF pp.24–26: phase interactions, chromatogram interpretation, locating and identification.
- Pearson 9CH0/03 June 2023 examiner report — Q6(a–c), printed/PDF pp.50–58. Two-solvent context treated as supplied application, not a universal recall requirement.
Finesse Tuition is not endorsed by AQA or Chemrevise. All explanations and examples here are our own.