
Use the Edexcel wavenumber table to infer and predict functional groups, then combine IR with mass spectra and chemical tests to justify a structure.
Why particular bonds absorb infrared radiation
Covalent bonds vibrate rather than remaining at one fixed length. They absorb infrared radiation when its frequency matches an allowed vibrational energy change. An IR-active vibration changes the molecule’s dipole moment. The relevant idea is a changing dipole during the vibration, not simply whether the whole molecule is permanently polar.
Different bond types and chemical environments absorb in characteristic ranges. A stronger bond generally vibrates at a higher frequency for comparable masses, while heavier bonded atoms tend to lower the frequency. Use the supplied correlation table rather than guessing from strength alone: neighbouring groups and hydrogen bonding shift and broaden absorptions.
Wavenumber is the reciprocal of wavelength, normally in cm⁻¹. Most exam plots show wavenumber decreasing from left to right. On a transmittance spectrum an absorption is a downward trough because less radiation passes through. An absorbance plot shows upward peaks. Name the feature as an absorption and quote its wavenumber so your interpretation does not depend on drawing direction.
Use Pearson’s ranges, then inspect the shape
The ranges below are from the 8CH0 Issue 3 data table, printed page 48, and focus on the groups in Topic 7. In an examination, use the supplied table even if another revision source uses a broader generic range. A wavenumber without a bond assignment, or a bond name without an observed range, leaves the evidence-to-inference link incomplete.
Do not identify every absorption in a complicated spectrum. Begin with the strongest diagnostic regions and use the question’s candidates or molecular formula. An absorption near 1715 cm⁻¹ supports a carbonyl but does not alone prove a ketone; acids and other carbonyl environments can overlap.
| Bond and environment | Range / cm⁻¹ | How to use it |
|---|---|---|
| C–H in alkane | 2962–2853 | Common in many organic structures; alone weak identification |
| C–H in alkene | 3095–3010 | Supports H attached to C=C; use alongside C=C |
| C–H in aldehyde | 2900–2820 and 2775–2700 | Useful alongside a carbonyl; features can be weak |
| C=C in isolated alkene | 1669–1645 | Supports an alkene, but intensity varies |
| O–H in alcohol | 3750–3200 | Often broad with hydrogen bonding; shape depends on sample |
| C=O in saturated alkyl aldehyde | 1740–1720 | Carbonyl evidence; combine with aldehyde C–H/test |
| C=O in alkyl ketone | 1720–1700 | Overlaps neighbouring carbonyl classes |
| O–H in carboxylic acid | 3300–2500 | Very broad, often spanning C–H region |
| C=O in alkyl carboxylic acid | 1725–1700 | Use together with very broad acid O–H |
| N–H in amine | 3500–3300 | Supports N–H; primary amines often show two stretching bands |
Separate broad O–H, very broad acid O–H and N–H
An alcohol commonly gives a broad O–H band in the higher-wavenumber region because different hydrogen-bonding environments give a range of stretching energies. A carboxylic acid often has a very broad O–H envelope extending down towards 2500 cm⁻¹ as well as a C=O absorption near 1700–1725 cm⁻¹. It is the combination that strongly supports COOH.
An amine containing N–H can absorb around 3300–3500 cm⁻¹. Its bands are usually narrower than a hydrogen-bonded alcohol O–H feature. Primary amines often have two N–H stretching absorptions, but compare the supplied spectrum and table rather than requiring perfectly resolved bands. An absorption from C–H near 2900 cm⁻¹ does not confirm an amine.
Pearson 8CH0/02 June 2023 Q4(c)(iii) used an ethylamine IR spectrum to ask for the diagnostic amine absorption. The mark scheme distinguishes that feature from common alkane absorptions and a carbonyl region. This supports choosing a group-specific feature rather than simply the deepest trough.
A repeatable route through an unfamiliar spectrum
First inspect whether a broad or very broad O–H band is present. Next inspect the carbonyl region, then C=C and any useful aldehyde C–H or N–H features. Record absences cautiously: a predicted strong O–H or C=O band absent from a clean spectrum can help reject a candidate, but a weak alkene band may be hard to see.
Below about 1500 cm⁻¹ lies a crowded fingerprint region with many coupled vibrations. Matching the whole pattern to a reliable reference spectrum under suitable conditions can support identification. Do not infer that every tiny fingerprint trough can be assigned from a short functional-group table, or that IR alone proves a sample is pure.
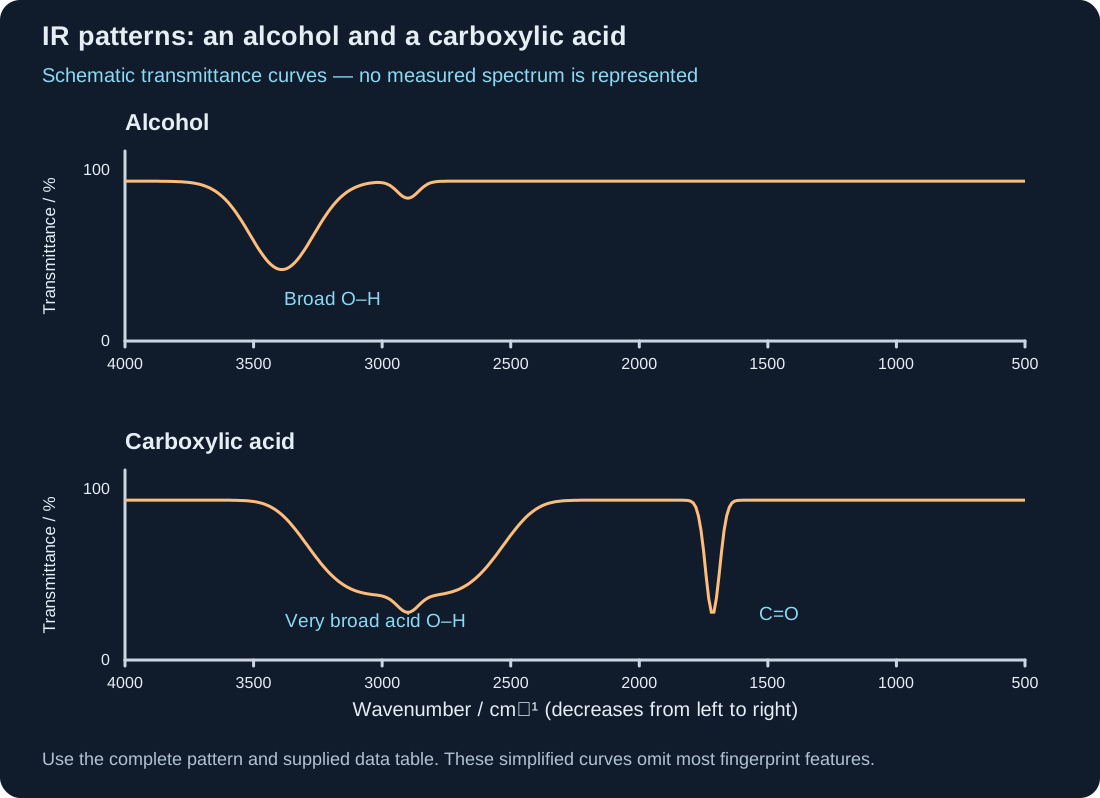
Swipe horizontally to view the whole diagram.
Predict what should change during a reaction
If propan-2-ol is oxidised to propanone, the alcohol O–H absorption should disappear and a strong C=O absorption should appear in the ketone range. The C–H absorptions remain because carbon–hydrogen bonds are still present. This is a stronger prediction than “the spectrum changes”.
If ethanol is fully oxidised to ethanoic acid, do not predict the disappearance of every O–H feature: an acid also has O–H, but its broad range and the added C=O distinguish it from the starting alcohol. A mixture of reactant and product can retain features of both. IR monitoring gives evidence of functional-group change, not automatically the percentage yield.
Hydrogenation of an alkene should remove the corresponding C=C and alkene C–H signals where present, while alkane C–H remains. An alkene with no H attached to its double-bond carbons cannot have an alkene C–H stretch from those atoms, so connect each predicted absorption to an actual bond.
Worked identification with three independent clues
An illustrative pure unknown is one of butan-1-ol, butanal, butan-2-one or ethanoic acid. Its molecular-ion peak is m/z 72, IR has a strong band at 1712 cm⁻¹ with no broad O–H, and warmed Fehling’s solution gives no red precipitate. The mass rejects butan-1-ol (74) and ethanoic acid (60); butanal and butan-2-one both have C₄H₈O and mass 72.
The carbonyl absorption and absence of O–H fit the two remaining candidates. The negative warmed Fehling’s test, under working controlled test conditions, favours the ketone: butan-2-one. A fragment at m/z 43 assigned to CH₃CO⁺ supports that structure. The justified final structure is CH₃COCH₂CH₃.
Write the chain of evidence: observation → bond or ion → eliminated/retained candidate → final structure. If the functional-group tests were not available, the mass and one carbonyl band alone would not uniquely distinguish these isomers. “Consistent with” is appropriate when evidence supports but does not uniquely prove a proposal.
Quick checks
Original Finesse questions. Reveal the indicative worked solutions after attempting each question; these are not official Edexcel mark allocations.
Q1. Why is an absorption a downward trough on a percentage-transmittance spectrum?Show answer
At the absorbed wavenumber less incident IR reaches the detector, so percentage transmittance decreases. An absorbance plot would show the feature upwards instead.
Q2. An unknown has a very broad absorption across 3300–2500 cm⁻¹ and a strong one at 1718 cm⁻¹. What group is supported?Show answer
A carboxylic acid: the very broad acid O–H plus a C=O within the alkyl carboxylic-acid range. Neither a generic O–H nor a carbonyl assignment alone is as diagnostic as the combination.
Q3. Predict two diagnostic spectral changes when butan-2-ol becomes butan-2-one.Show answer
The alcohol O–H feature in the 3750–3200 cm⁻¹ range disappears, and a ketone C=O absorption appears around 1720–1700 cm⁻¹. C–H absorptions remain.
Q4. Why does a carbonyl absorption alone not distinguish an aldehyde from a ketone?Show answer
Both contain C=O and their ranges are close/overlapping. Use aldehyde C–H bands, a warmed Fehling’s/Benedict’s test and other evidence; do not overinterpret a small shift without context.
Q5. A sample has M⁺ at 60 and broad O–H but no C=O. Could it be ethanoic acid or propan-1-ol?Show answer
Both have nominal mass 60, so mass alone does not decide. The absence of C=O and an alcohol-like O–H favour propan-1-ol; ethanoic acid should also show a carbonyl and a very broad acid O–H. Other C₃H₈O isomers may remain if the candidate list is not restricted.
Sources
Sources and examiner guidance (reviewed 9 October 2026)
- Pearson Edexcel 9CH0 specification — Issue 3 — Topic 7 7.2(i–vi), printed page 21; reviewed 9 October 2026.
- Pearson Edexcel 8CH0 specification — Issue 3 — Topic 7 printed page 19; infrared correlation table printed page 48. AS scope verified.
- Chemrevise — Edexcel Mass spectra and IR — Pages 2–3; secondary explanation checked against Pearson. Original examples and practice.
- Pearson 8CH0/02 — June 2023 mark scheme — Q4(c)(iii), PDF page 20; diagnostic amine absorption, read with question paper printed page 15.
- Pearson 8CH0 data booklet within specification — Printed page 48; exact infrared ranges checked 9 October 2026. These take precedence over broad secondary-guide ranges.
Finesse Tuition is not endorsed by AQA or Chemrevise. All explanations and examples here are our own.