
Determine a rate law from measured changes and recognise how zero-, first- and second-order behaviour appears in data.
Define the measured rate and its sign
Reaction rate describes change in concentration per unit time, usually mol dm⁻³ s⁻¹. A reactant concentration falls, so its disappearance rate is −Δ[reactant]/Δt; a product formation rate is positive Δ[product]/Δt. An instantaneous rate is a tangent gradient, while a change over a finite interval is an average.
For aA → bB, a consistently normalised reaction rate is −(1/a)d[A]/dt = (1/b)d[B]/dt. School data may instead specify the disappearance rate of a particular species, so state the quantity being calculated and use the same convention throughout. A gas-volume slope initially has units cm³ s⁻¹, not automatically mol dm⁻³ s⁻¹.
The initial rate is the rate at the beginning, t = 0. It is often largest in a simple reaction as reactants are subsequently depleted, but “fastest rate” is not its definition; induction periods or product catalysis can make later behaviour more complicated.
The rate equation rate = k[A]ᵐ[B]ⁿ is an experimentally determined relationship for the conditions studied. The order with respect to A is m; the overall order is m + n. The rate constant k is the proportionality constant for a given temperature, catalyst and medium. Orders need not equal coefficients in the overall chemical equation.
Worked example: isolate one concentration change
Use the original table at fixed temperature. Comparing experiments 1 and 2 doubles [A] while [B] is fixed and doubles rate: first order in A. Comparing 1 and 3 doubles [B] while [A] is fixed and multiplies rate by four: second order in B. Hence rate = k[A][B]², third order overall.
From experiment 1, k = (2.00 × 10⁻⁵)/(0.0400 × 0.100²) = 0.0500 dm⁶ mol⁻² s⁻¹. Its units are (mol dm⁻³ s⁻¹)/(mol³ dm⁻⁹), which simplify to dm⁶ mol⁻² s⁻¹. Substituting experiment 3 gives the same k.
If both [A] and [B] double, rate multiplies by 2 × 2² = 8, so the predicted rate is 1.60 × 10⁻⁴ mol dm⁻³ s⁻¹. If two variables change in a comparison, divide out the known factor before deducing the remaining order. A simple concentration ratio is insufficient by itself.
Zero order means changing that concentration does not change the rate within the range studied. The substance can still be consumed in the overall reaction; it may react after the rate-controlling stage. Do not extrapolate a zero-order law to an absent essential reactant.
| Experiment | [A] / mol dm⁻³ | [B] / mol dm⁻³ | Initial rate / mol dm⁻³ s⁻¹ |
|---|---|---|---|
| 1 | 0.0400 | 0.100 | 2.00 × 10⁻⁵ |
| 2 | 0.0800 | 0.100 | 4.00 × 10⁻⁵ |
| 3 | 0.0400 | 0.200 | 8.00 × 10⁻⁵ |
Recognise order from rate and concentration graphs
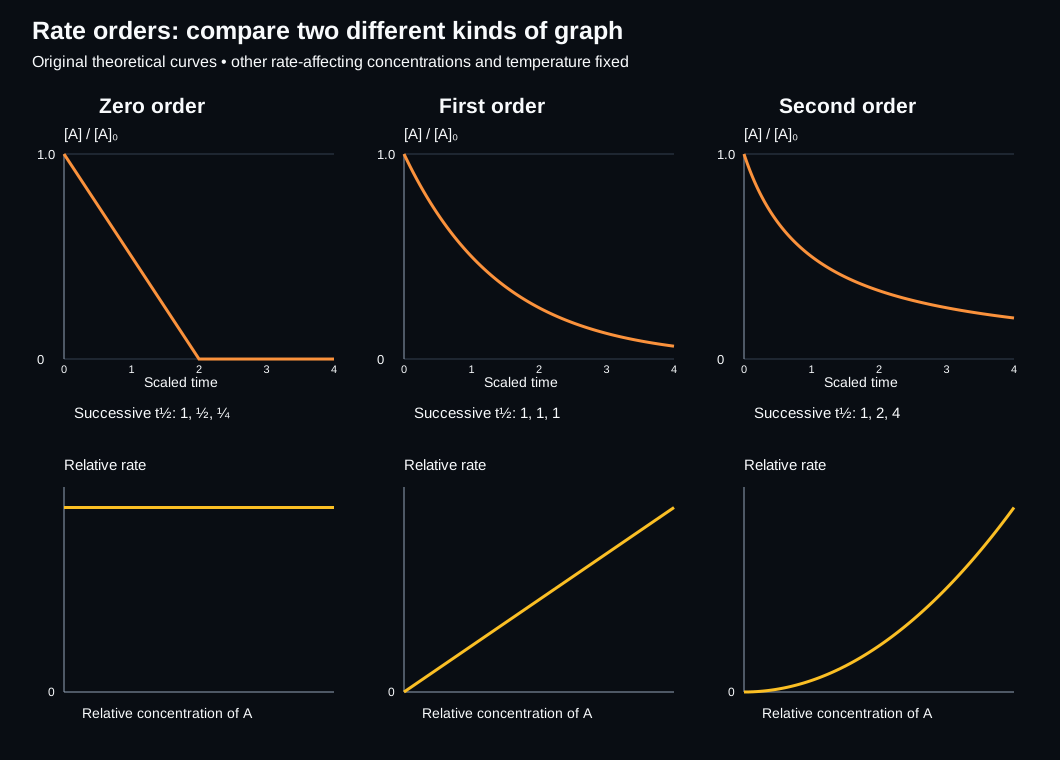
With other relevant concentrations and temperature fixed, a rate–concentration graph is horizontal for zero order, a straight line through the origin for first order and an upward-curving parabola for second order. For second order, plotting rate against concentration squared gives a straight line through the origin.
For a concentration–time graph, zero-order disappearance gives a straight decline because the rate stays constant. First-order decay curves upward toward zero: its negative slope becomes smaller in magnitude as concentration falls. Second-order decay also curves, so shape alone is not a reliable first-versus-second-order test.
Take tangent gradients at several concentrations and compare rate with concentration, or use successive half-lives under appropriate single-variable conditions. For first order, successive half-lives are equal; for second order in one reacting species they double as concentration halves; for zero order they halve. Other reactant concentrations must be constant or their effects must be accounted for.
Swipe horizontally to view the whole diagram.
Extract rates and half-lives with the right axes
A half-life is the time for the concentration of the selected reactant to fall to half its value. If concentrations are 0.0800, 0.0400, 0.0200 and 0.0100 mol dm⁻³ at 0, 30, 60 and 90 s, successive half-lives are 30 s, supporting first order when other influences are fixed.
An original tangent to a different concentration–time curve passes through (10 s, 0.060 mol dm⁻³) and (50 s, 0.030 mol dm⁻³). Gradient = (0.030 −0.060)/(50 −10) = −7.50 × 10⁻⁴ mol dm⁻³ s⁻¹. The disappearance rate is its positive magnitude. Use widely spaced points on the tangent, not two arbitrary curve points.
If product gas volume approaches V∞ = 80.0 cm³, the amount of reactant remaining is proportional to V∞ − Vt for the stated stoichiometry and gas conditions. Read successive halvings of the remaining amount: product volumes 40.0, 60.0 and 70.0 cm³ correspond to remaining fractions ½, ¼ and ⅛. Halving the product volume itself is the wrong test.
For a simple first-order process, t½ = ln 2/k is a useful extension. A 30.0 s half-life gives k = 0.693147/30.0 = 0.0231 s⁻¹. This relation assumes the measured first-order constant corresponds to that decay; a pseudo-first-order constant can contain fixed concentrations of excess reagents.
Choose a technique from a chemical signal
An experimental method must measure a property that can be related quantitatively to amount or concentration. State what is measured, why it changes and how it is converted into rate data. “Watch for a colour change” is not by itself a continuous measurement technique.
Colorimetry can track a coloured reactant or product: select a suitable wavelength/filter, use a reagent blank and calibration, keep the optical path consistent and follow absorbance within its calibrated concentration range. Titration of timed aliquots suits a species with a selective analytical reaction, but the sampled reaction must be quenched without destroying the analyte.
Gas collection suits a gas-producing reaction if a gas syringe or sensor can record the changing amount, with leak-free apparatus and controlled temperature/pressure. Mass loss can track escaping gas, but evaporation and splashing create bias and very light gases can give small signals. A conductivity probe is an alternative when ion concentration/mobility changes in a interpretable way.
Choose enough time points to resolve early changes and repeat experiments to assess reproducibility. If a process is too fast for manual sampling, a faster sensor or suitable slower conditions are needed; better handwriting cannot correct inadequate time resolution.
| Method | Useful signal | Concrete limitation/control |
|---|---|---|
| Titration | Known aliquot concentration | Quench promptly; identify titrant and stoichiometry |
| Colorimetry | Absorbance of a coloured species | Calibrate; avoid other absorbing species |
| Mass loss | Gas leaves the reacting vessel | Limit evaporation/splashing; keep balance stable |
| Gas volume | Product gas collected | Check leaks, syringe friction and gas solubility |
| Conductivity | Changing ionic composition | Temperature and contributions of all ions matter |
Quick checks
Original Finesse questions. Reveal the indicative worked solutions after attempting each question; these are not official Edexcel mark allocations.
Q1. For rate = k[A]²[B]⁰, state the orders and the factor change if [A] triples and [B] doubles.Show answer
A is second order, B zero order and overall order is two. The rate factor is 3² ×2⁰ = 9. B may still take part in the overall reaction.
Q2. For rate = k[A][B], rate is 1.20 × 10⁻⁴ mol dm⁻³ s⁻¹ when [A] = 0.200 and [B] = 0.300 mol dm⁻³. Find k with units.Show answer
k = 1.20 × 10⁻⁴/(0.200 ×0.300) = 2.00 × 10⁻³ dm³ mol⁻¹ s⁻¹. Overall order is two, so concentration is removed once from the rate units.
Q3. A reactant concentration halves at 20 s and halves again by 60 s. Is this consistent with constant first-order half-life?Show answer
No. Successive intervals are 20 s and 40 s, not both 20 s. Doubling successive half-lives is consistent with simple second-order decay, provided other factors are fixed.
Q4. A gas-volume curve ends at 100 cm³. Which product volumes correspond to two successive halvings of reactant remaining?Show answer
50 cm³ and 75 cm³. Remaining gas-to-be-formed is 50 then 25 cm³; it is V∞ −Vt that follows reactant remaining.
Q5. Why must an aliquot be quenched before a slow titration for kinetic analysis?Show answer
Without quenching, its composition continues changing between sampling and measurement, so the titre no longer represents the assigned sampling time. The quench must stop or greatly slow the studied reaction without consuming the analyte.
Sources
Sources and examiner guidance (reviewed 9 October 2026)
- Pearson Edexcel 9CH0 specification — Issue 3, February 2024 — Topic 16; the scope authority. Reviewed 9 October 2026.
- Chemrevise — Edexcel Topic 16 — Pages 1–5; explanatory and coverage cross-check. Teaching, examples and practice here are original Finesse material.
- Pearson 9CH0/03 mark scheme — June 2023 — Q8(a), PDF pp.34–35, and Q8(c)(i), p.37: monitoring, rate expressions and Arrhenius gradient conversion.
- Pearson 9CH0/03 examiner report — June 2023 — Q8(a)(i), printed/PDF p.77; Q8(a)(iii), p.80; Q8(c)(i), pp.84–88: specify a technique and quench, preserve powers/charges, convert slope to positive Ea.
Finesse Tuition is not endorsed by AQA or Chemrevise. All explanations and examples here are our own.