
Explain separation through competing interactions, calculate Rf and use calibrated detector response to determine an amount.
Separation depends on two phases
Chromatography separates components because they interact differently with a stationary phase and a mobile phase. A component held more strongly by the stationary phase tends to move more slowly; one with greater preference for the mobile phase tends to move more quickly under the same conditions.
In thin-layer chromatography, the stationary phase is commonly silica on a plate and the mobile phase is a solvent or solvent mixture moving up it. On ordinary polar silica, stronger attraction to the surface generally reduces travel for a given solvent. Changing solvent composition can change the separation, so avoid universal rankings independent of conditions.
In gas chromatography a carrier gas transports vaporised components through a column containing the stationary phase. Retention depends on interactions with that phase and volatility, as well as operating conditions. GC is appropriate for samples that can be vaporised without unsuitable decomposition under the chosen conditions.
The baseline and solvent front define the measurement
Draw a pencil baseline above the solvent level. Apply small concentrated spots and allow them to dry; large wet spots can spread and overlap. Place the plate in a suitable covered chamber with the baseline above the solvent so the samples are carried up the plate rather than dissolving directly into the reservoir.
Remove the plate before the solvent reaches the top and mark the solvent front promptly, before evaporation obscures it. Locate colourless spots using a suitable method such as UV viewing or an appropriate locating agent. The method must be compatible with the substances and laboratory controls.
Measure from the baseline to the centre of each spot and from the same baseline to the solvent front. Rf = distance travelled by component / distance travelled by solvent front. It is dimensionless and normally between 0 and 1 for a valid spot within the developed region.
Worked example: identity requires matching conditions
An original plate has a solvent front 7.50 cm above the baseline and a sample spot 4.20 cm above it. Rf = 4.20/7.50 = 0.560. The plate’s bottom edge is irrelevant to the ratio. A second spot at 1.80 cm has Rf = 0.240, showing at least two detected components in that sample.
Compare with reference compounds run under the same conditions, ideally on the same plate. A matching Rf supports a possible identity but does not prove it: different substances can co-migrate. A single spot also does not guarantee absolute purity because components may overlap or fail to be detected.
If all spots remain near the baseline or travel with the front, the solvent system may give poor discrimination. Modify conditions appropriately and compare again rather than treating an uninformative plate as definitive evidence.
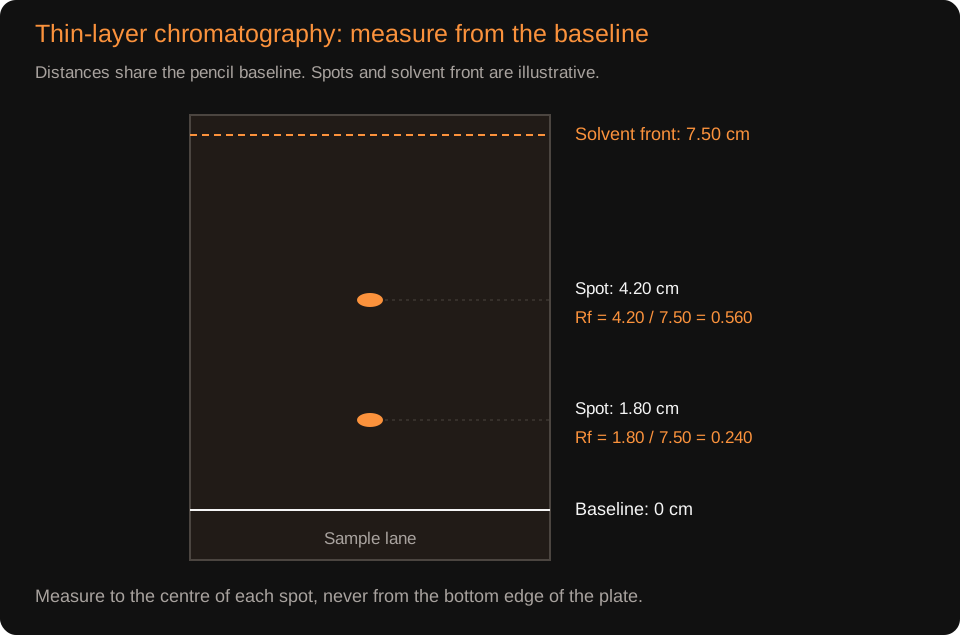
Swipe horizontally to view the whole diagram.
Retention time and peak area answer different questions
Retention time is the time from injection to detection of a component’s peak. Compare it with known standards under the same column, temperature and carrier-gas conditions to support identity. Different compounds can have similar retention times, so additional evidence or a coupled method can strengthen identification.
Peak area reflects detector response and can be related to amount using calibration. Peak height alone is not automatically proportional to amount if peak widths differ. Even area percentages are not necessarily mole or mass percentages unless relative detector responses justify that conversion.
For an external calibration, analyse known concentrations of the relevant compound under the same conditions, plot detector response against concentration and use the fitted relationship for the unknown within the validated range. Account for any dilution before reporting the original sample concentration.
Worked quantitative GC example
To construct this original calibration, standards at c = 0, 1.00, 2.00 and 4.00 mg dm⁻³ give areas 10, 260, 510 and 1010. Plot area vertically against concentration horizontally. The straight-line gradient is (1010 − 10)/(4.00 − 0) = 250 area units per mg dm⁻³, and the intercept is 10. Replicate measurements and a best-fit line are preferable to assuming perfect laboratory data; these deliberately exact values isolate the calculation method.
An illustrative external calibration for compound X gives A = 250c + 10, where A is integrated peak area in arbitrary units and c is concentration in mg dm⁻³. An unknown diluted solution gives A = 910. Rearranging: c = (910 − 10)/250 = 3.60 mg dm⁻³.
The solution was made by diluting 5.00 cm³ of the original sample to 50.0 cm³. The dilution factor is 10.0, so the original concentration is 36.0 mg dm⁻³. If the original sample volume is 0.250 dm³, it contains 36.0 × 0.250 = 9.00 mg of X.
Subtract the intercept before dividing by the gradient. Multiplying area directly by the dilution factor without first applying the calibration ignores the background response. Use standards spanning the unknown’s concentration and do not assume the calibration remains linear arbitrarily far beyond them.
Quick checks
Original Finesse questions. Reveal the indicative worked solutions after attempting each question; these are not official OCR A mark allocations.
Q1. A spot travels 3.15 cm while the solvent front travels 6.30 cm from the baseline. Calculate Rf.Show answer
Rf = 3.15/6.30 = 0.500, with no units. Both distances use the same baseline.
Q2. Why must the starting spots be above the solvent reservoir?Show answer
Otherwise the sample can dissolve into the reservoir instead of being carried up the stationary phase, compromising separation.
Q3. Does one TLC spot prove that a sample contains only one substance?Show answer
No. Different substances can co-migrate, and some may not be detected by the chosen locating method. One spot supports purity only within the method’s limitations.
Q4. A calibration is A = 120c + 5. An unknown has A = 365. Find c, then correct for a fourfold dilution.Show answer
c = (365 − 5)/120 = 3.00 in the calibration’s concentration units. The original concentration is 4 × 3.00 = 12.0 in those units.
Q5. Why can GC area percentages differ from mass percentages?Show answer
Different compounds may give different detector responses per unit mass. Relative response factors or appropriate calibration are needed before converting areas into composition.
Sources
Sources and examiner guidance (reviewed 6 October 2026)
- OCR A H432 specification — version 3.1 — 6.3.1, printed pp. 61–62; outcomes and additional guidance, with relevant Module 1 practical skills.
- Chemrevise — OCR A 6.3.1 — Pages 1–3; secondary coverage cross-check. Lesson explanations, data and questions are original Finesse material.
- OCR H432/02 mark scheme — June 2025 — Q21(c), Q22(a)(i); printed pp. 29,33. Question-specific evidence, not universal marking rules.
- OCR H432/02 examiner report — June 2025 — Q21(c), Q22(a)(i); printed pp. 45,49. Read with the corresponding question context.
- OCR H432/02 question paper — June 2025 — Q21(c), Q22(a)(i); context for the assessment references, not reproduced questions.
Finesse Tuition is not endorsed by AQA or Chemrevise. All explanations and examples here are our own.